
Concatenation#
With treedata.concat(), treedata.TreeData objects can be combined via a composition of two operations: concatenation and merging.
Concatenation is when we keep all sub elements of each object, and stack these elements in an ordered way.
Merging is combining a set of collections into one resulting collection which contains elements from the objects.
This logic is identical to anndata.concat() so you should check out the the anndata concatenation tutorial to understand the basics. This tutorial will focus on how the obst and vart fields in TreeData objects are handled during concatenation and merging.
import networkx as nx
import numpy as np
import pandas as pd
import treedata as td
import matplotlib.pyplot as plt
def plot_tree(tree, color_attr=None):
    """Helper function for plotting trees."""
    plt.figure(figsize=(6, 3))
    node_colors = "lightgrey" if color_attr is None else [tree.nodes[node].get(color_attr) for node in tree.nodes()]
    pos = nx.drawing.nx_agraph.graphviz_layout(tree, prog="dot")
    nx.draw(tree, pos, with_labels=False, node_size=100, node_color=node_colors)
    leaf_nodes = [node for node in tree.nodes() if tree.out_degree(node) == 0]
    for node, (x, y) in pos.items():
        if node in leaf_nodes:
            plt.text(x, y + 10, s=node, rotation=90, fontsize=6, ha="center", va="top")
        else:
            plt.text(x, y, s=node, fontsize=6, ha="center", va="center")
    plt.show()
Concatenation#
Let’s start by creating a TreeData object with 32 observations and 32 variables with a tree aligned to each axis.
counts = pd.DataFrame(
    np.random.normal(size=(32, 32)),
    index=[f"Obs_{i:d}" for i in range(32)],
    columns=[f"Var_{i:d}" for i in range(32)],
)
tree = nx.balanced_tree(r=2, h=5, create_using=nx.DiGraph)
leaves = [i for i in tree.nodes if tree.out_degree(i) == 0]
obs_tree = nx.relabel_nodes(tree, {j: f"Obs_{i}" for i, j in enumerate(leaves)})
var_tree = nx.relabel_nodes(tree, {j: f"Var_{i}" for i, j in enumerate(leaves)})
tdata = td.TreeData(counts, obst={"tree": obs_tree}, vart={"tree": var_tree}, label=None)
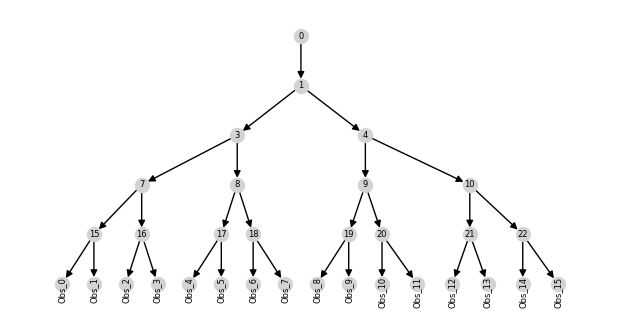
When we split the the TreeData along the observations axis, each tree in obst is a subtree of the original obst value while each tree in vart remains unchanged.
tdata1 = tdata[:16]
tdata2 = tdata[16:]
plot_tree(tdata1.obst["tree"])
tdata1
View of TreeData object with n_obs × n_vars = 16 × 32
    obst: 'tree'
    vart: 'tree'
If we then concatenate the two TreeData objects along the observations axis, each tree in the obst field is generated by combining the trees with that key. In this case, it is the original tree since we have not modified any of the obst values.
tdata_concat = td.concat([tdata1, tdata2], axis=0)
plot_tree(tdata_concat.obst["tree"])
tdata_concat
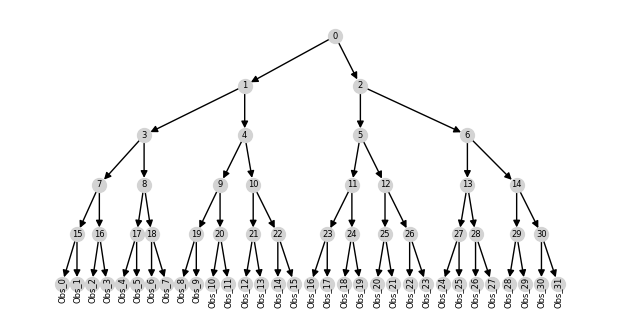
TreeData object with n_obs × n_vars = 32 × 32
    obst: 'tree'
But if we were to remove the observation tree in tdata1, the tree in the concatenated obst field would be the tree in tdata2.
del tdata1.obst["tree"]
tdata_concat = td.concat([tdata1, tdata2], axis=0)
plot_tree(tdata_concat.obst["tree"])
tdata_concat
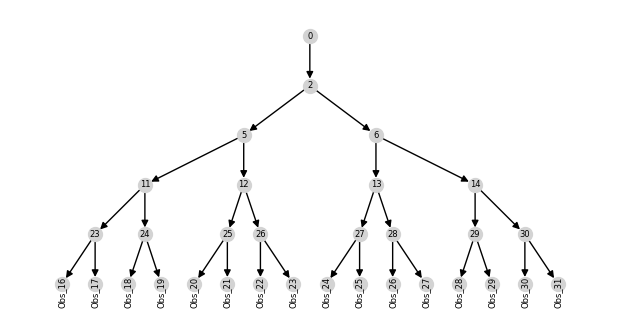
TreeData object with n_obs × n_vars = 32 × 16
    obst: 'tree'
You may have noticed that there is no tree in the vart field of the concatenated TreeData object which leads us to an explanation of the merging operation.
Merging#
Combining elements not aligned to the axis of concatenation is controlled through the merge argument. We provide a few strategies for merging elements aligned to the alternative axes:
None: No elements aligned to alternative axes are present in the result object.
"same": Elements that are the same in each of the objects.
"unique": Elements for which there is only one possible value.
"first": The first element seen in each from each position.
"only": Elements that show up in only one of the objects.
The default merge strategy is None which is why the vart field is empty in the concatenated TreeData object.
tdata1 = tdata[:16]
tdata2 = tdata[16:]
tdata_concat = td.concat([tdata1, tdata2], axis=0)
tdata_concat
TreeData object with n_obs × n_vars = 32 × 32
    obst: 'tree'
But if we set merge="same", the vart field will contain the tree since tdata1.vart['tree'] and tdata2.vart['tree'] are the same.
tdata_concat = td.concat([tdata1, tdata2], axis=0, merge="same")
plot_tree(tdata_concat.vart["tree"])
tdata_concat
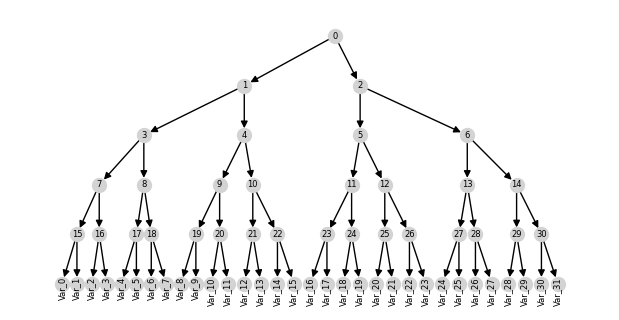
TreeData object with n_obs × n_vars = 32 × 32
    obst: 'tree'
    vart: 'tree'
Alternatively, if the trees were not the same, we could set merge="first" to keep the tree in tdata1.vart['tree'].
tdata1.vart["tree"] = nx.relabel_nodes(tdata1.vart["tree"], {0: "root"})
tdata_concat = td.concat([tdata1, tdata2], axis=0, merge="first")
plot_tree(tdata_concat.vart["tree"])
tdata_concat

TreeData object with n_obs × n_vars = 32 × 32
    obst: 'tree'
    vart: 'tree'
Inner and outer joins#
When the variables present in the objects to be concatenated aren’t exactly the same, you can choose to take either the intersection or union of these variables. This is otherwise called taking the "inner" (intersection) or "outer" (union) join. For example, given two TreeData objects with differing variables:
tdata1 = tdata[:16, :24]
tdata2 = tdata[16:, 8:]
print("tdata1 var_names", tdata1.var_names)
print("tdata2 var_names", tdata2.var_names)
tdata1 var_names Index(['Var_0', 'Var_1', 'Var_2', 'Var_3', 'Var_4', 'Var_5', 'Var_6', 'Var_7',
       'Var_8', 'Var_9', 'Var_10', 'Var_11', 'Var_12', 'Var_13', 'Var_14',
       'Var_15', 'Var_16', 'Var_17', 'Var_18', 'Var_19', 'Var_20', 'Var_21',
       'Var_22', 'Var_23'],
      dtype='object')
tdata2 var_names Index(['Var_8', 'Var_9', 'Var_10', 'Var_11', 'Var_12', 'Var_13', 'Var_14',
       'Var_15', 'Var_16', 'Var_17', 'Var_18', 'Var_19', 'Var_20', 'Var_21',
       'Var_22', 'Var_23', 'Var_24', 'Var_25', 'Var_26', 'Var_27', 'Var_28',
       'Var_29', 'Var_30', 'Var_31'],
      dtype='object')
When join="inner" and merge="first", the resulting TreeData object will contain only the variables present in both objects and the vart field will contain the tree from tdata1 subset to this set of variables.
tdata_inner = td.concat([tdata1, tdata2], axis=0, join="inner", merge="first")
plot_tree(tdata_inner.vart["tree"])
tdata_inner
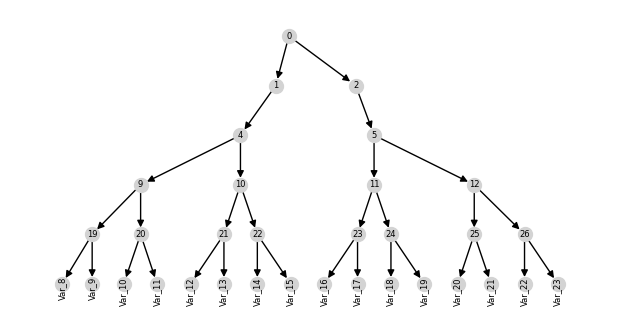
TreeData object with n_obs × n_vars = 32 × 16
    obst: 'tree'
    vart: 'tree'
When join=”outer” and merge=”first”, the resulting TreeData object will contain all variables present in either object and the vart field will contain the tree from tdata1.
tdata_outer = td.concat([tdata1, tdata2], axis=0, join="outer", merge="first")
plot_tree(tdata_outer.vart["tree"])
tdata_outer
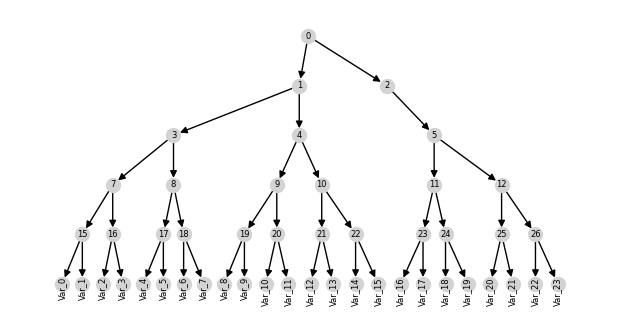
TreeData object with n_obs × n_vars = 32 × 32
    obst: 'tree'
    vart: 'tree'
As you can see trees are not combined along the alternate axis during concatenation. If you wish to combine trees along a particular axis, you need to specify it as the concatenation axis. For example, if you want to combine vart trees, you should concatenate along the variables axis (axis = 1).