
Getting started with treedata#
treedata.TreeData is a lightweight wrapper around anndata.AnnData which adds two additional attributes, obst and vart,
to store trees for observations and variables. This tutorial will walk you through the basic usage of TreeData, including how to create,
subset, and manipulate TreeData objects. If you want to learn more about how TreeData used to analyze single-cell lineage tracing data
check out the Pycea getting started tutorial.
import networkx as nx
import numpy as np
import pandas as pd
import scanpy as sc
import treedata as td
import matplotlib.pyplot as plt
import random
def plot_tree(tree, color_attr=None):
    """Helper function for plotting trees."""
    plt.figure(figsize=(6, 3))
    node_colors = "lightgrey" if color_attr is None else [tree.nodes[node].get(color_attr) for node in tree.nodes()]
    pos = nx.drawing.nx_agraph.graphviz_layout(tree, prog="dot")
    nx.draw(tree, pos, with_labels=False, node_size=100, node_color=node_colors)
    leaf_nodes = [node for node in tree.nodes() if tree.out_degree(node) == 0]
    for node, (x, y) in pos.items():
        if node in leaf_nodes:
            plt.text(x, y + 10, s=node, rotation=90, fontsize=6, ha="center", va="top")
        else:
            plt.text(x, y, s=node, fontsize=6, ha="center", va="center")
    plt.show()
Initializing TreeData#
A TreeData object is initialized just like an AnnData object. Let’s create a TreeData object with 32 cells and 100 genes.
counts = pd.DataFrame(
    np.random.normal(size=(32, 100)),
    index=[f"Cell_{i:d}" for i in range(32)],
    columns=[f"Gene_{i:d}" for i in range(100)],
)
tdata = td.TreeData(counts)
tdata
TreeData object with n_obs × n_vars = 32 × 100
Now, suppose we have an nx.DiGraph tree representing relationships between cells, perhaps from a lineage tracing experiment
tree = nx.balanced_tree(r=2, h=5, create_using=nx.DiGraph)
leaves = [i for i in tree.nodes if tree.out_degree(i) == 0]
tree = nx.relabel_nodes(tree, {j: f"Cell_{i}" for i, j in enumerate(leaves)})
nx.set_node_attributes(tree, "lightblue", "color")
plot_tree(tree, "color")
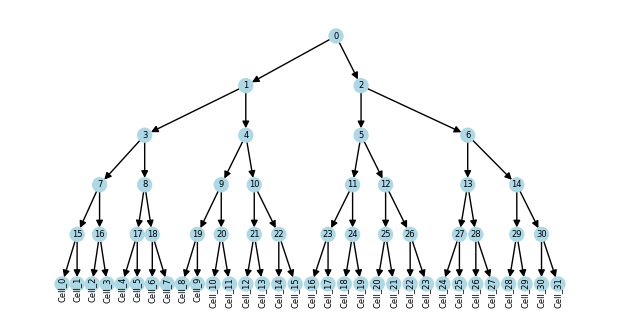
We can store this tree in the obst attribute of the TreeData object
tdata.obst["lineage"] = tree
tdata
TreeData object with n_obs × n_vars = 32 × 100
    obs: 'tree'
    obst: 'lineage'
The obs dataframe now contains a column with tree membership
tdata.obs.head()
| tree | |
|---|---|
| Cell_0 | lineage |
| Cell_1 | lineage |
| Cell_2 | lineage |
| Cell_3 | lineage |
| Cell_4 | lineage |
A TreeData object can also be initialized with only the tree
td.TreeData(obst={"lineage": tree})
TreeData object with n_obs × n_vars = 32 × 0
    obs: 'tree'
    obst: 'lineage'
Or with only the tree and associated observation data
obs = pd.DataFrame({"cluster": np.random.randint(0, 5, size=32)}, index=[f"Cell_{i:d}" for i in range(32)])
td.TreeData(obst={"lineage": tree}, obs=obs)
TreeData object with n_obs × n_vars = 32 × 0
    obs: 'cluster', 'tree'
    obst: 'lineage'
Subsetting TreeData#
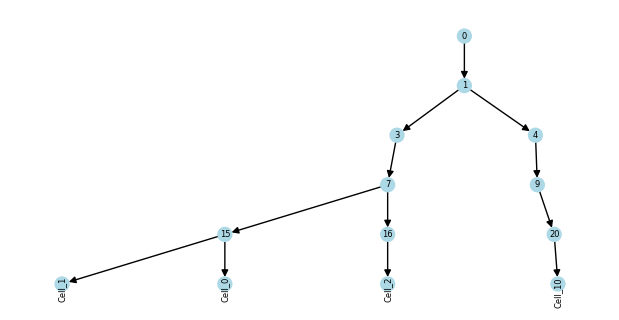
Similar to AnnData, we can subset TreeData along the obs and var axes, which provides a view of the TreeData object.
tdata_subset = tdata[["Cell_0", "Cell_1", "Cell_2", "Cell_10"], ["Gene_5", "Gene_19"]]
tdata_subset
View of TreeData object with n_obs × n_vars = 4 × 2
    obs: 'tree'
    obst: 'lineage'
Just like obs and obsm annotations, the trees stored in obst are subset along with the data. Specifically, a subtree is created with the selected leaves and their ancestors.
plot_tree(tdata_subset.obst["lineage"], "color")
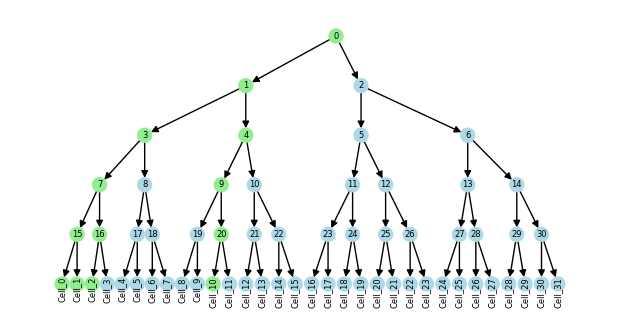
Since the subtree is a view of the original tree, changes to node attributes in the subtree will be reflected in the original tree.
nx.set_node_attributes(tdata_subset.obst["lineage"], "lightgreen", "color")
plot_tree(tdata.obst["lineage"], "color")
Views and copies#
TreeData views such as tdata_subset store a reference to the original data
tdata_subset = tdata[:20, :]
tdata_subset
View of TreeData object with n_obs × n_vars = 20 × 100
    obs: 'tree'
    obst: 'lineage'
If we want a TreeData object with its own copy of the data, we can use the copy method.
tdata_subset.copy()
TreeData object with n_obs × n_vars = 20 × 100
    obs: 'tree'
    obst: 'lineage'
If we add new data to tdata_subset, it can no longer be a reference to tdata, so it auto-copies generating a data-storing object.
tdata_subset.obs["foo"] = "bar"
tdata_subset
TreeData object with n_obs × n_vars = 20 × 100
    obs: 'tree', 'foo'
    obst: 'lineage'
The toplogy of trees stored in obst and vart is frozen so you cannot add/remove nodes or edges. However, you can change node attributes.
try:
    tdata.obst["lineage"].remove_node("Cell_0")
except nx.NetworkXError as e:
    print(e)
tdata.obst["lineage"].nodes["Cell_1"]["color"] = "plum"
Frozen graph can't be modified
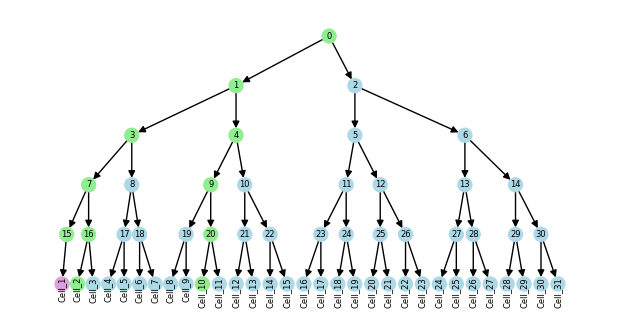
If you need to change the topology of the tree, you can create a copy, modify the tree, and then assign it back to the obst attribute.
tree = tdata.obst["lineage"].copy()
tree.remove_node("Cell_0")
tdata.obst["lineage"] = tree
plot_tree(tdata.obst["lineage"], "color")
Multiple trees#
TreeData can store multiple observation and variable trees in the obst and vart attributes. As an example, we’ll create two variable trees which could represent a hierarchical clustering of genes.
tree = nx.balanced_tree(r=2, h=5, create_using=nx.DiGraph)
genes_1 = random.sample(list(tdata.var_names), 32)
genes_2 = random.sample(list(tdata.var_names), 32)
tree_1 = nx.relabel_nodes(tree.copy(), {i + 31: j for i, j in enumerate(genes_1)})
tree_2 = nx.relabel_nodes(tree.copy(), {i + 31: j for i, j in enumerate(genes_2)})
plot_tree(tree_1)
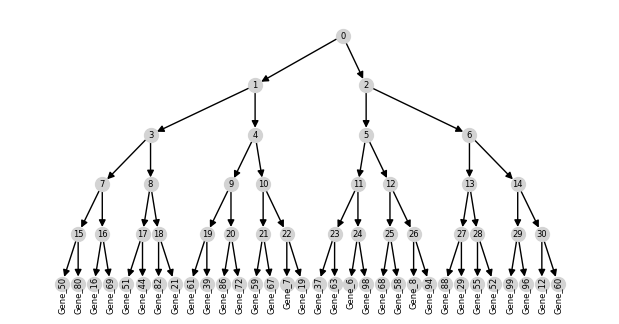
We’ll store these trees in vart as "clustering_1" and "clustering_2"
tdata.vart["clustering_1"] = tree_1
tdata.vart["clustering_2"] = tree_2
The tree column in the var dataframe now contains a list of tree memberships with some genes belonging to both trees.
tdata.var["tree"].value_counts()
tree
clustering_2                 22
clustering_1                 22
clustering_1,clustering_2    10
Name: count, dtype: int64
To dissallow overlapping trees, you can set the allow_overlap parameter to False.
del tdata.vart["clustering_2"]
tdata.allow_overlap = False
try:
    tdata.vart["clustering_2"] = tree_2
except ValueError as e:
    print(e)
Leaf names overlap with leaf names of other trees. Set `allow_overlap=True` to allow this.
Alignment#
By default, obs_names and var_names are aligned to the leaves of trees stored in obst and vart. However, TreeData supports multiple alignment types which can be declared using the alignment parameter. See the Alignment tutorial for more details.
For example, we can create a TreeData object with alignment='nodes' where all nodes in the tree are observed instead of just the leaves.
tree = nx.balanced_tree(r=2, h=5, create_using=nx.DiGraph)
tree = nx.relabel_nodes(tree, {i: str(i) for i in tree.nodes()})
nodes_tdata = td.TreeData(obs=pd.DataFrame(index=tree.nodes()), obst={"lineage": tree}, alignment="nodes")
nodes_tdata
TreeData object with n_obs × n_vars = 63 × 0
    obs: 'tree'
    obst: 'lineage'
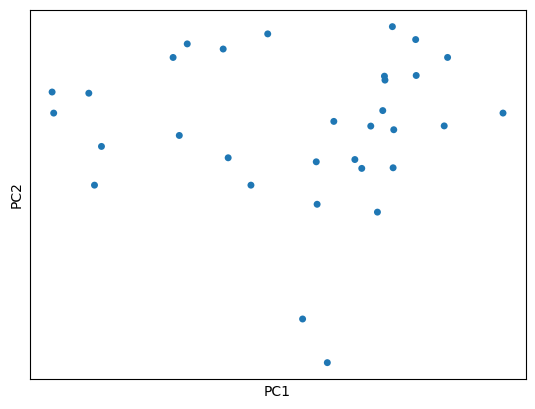
Scverse integration#
Since the TreeDataobject has the same interface as the AnnData object, it can be used anywhere AnnData is used, including with scverse packages like scanpy and squidpy.
sc.tl.pca(tdata, svd_solver="arpack")
sc.pl.pca(tdata, size=100, na_color="tab:blue")
And if you ever need to convert a TreeData object to an AnnData object, you can use the to_adata method.
adata = tdata.to_adata()
adata
AnnData object with n_obs × n_vars = 32 × 100
    obs: 'tree'
    var: 'tree'
    uns: 'pca'
    obsm: 'X_pca'
    varm: 'PCs'